Risk Basics Day‑0: Volatility, Drawdowns, and Time on One Simple Chart
TL;DR
Quick Summary
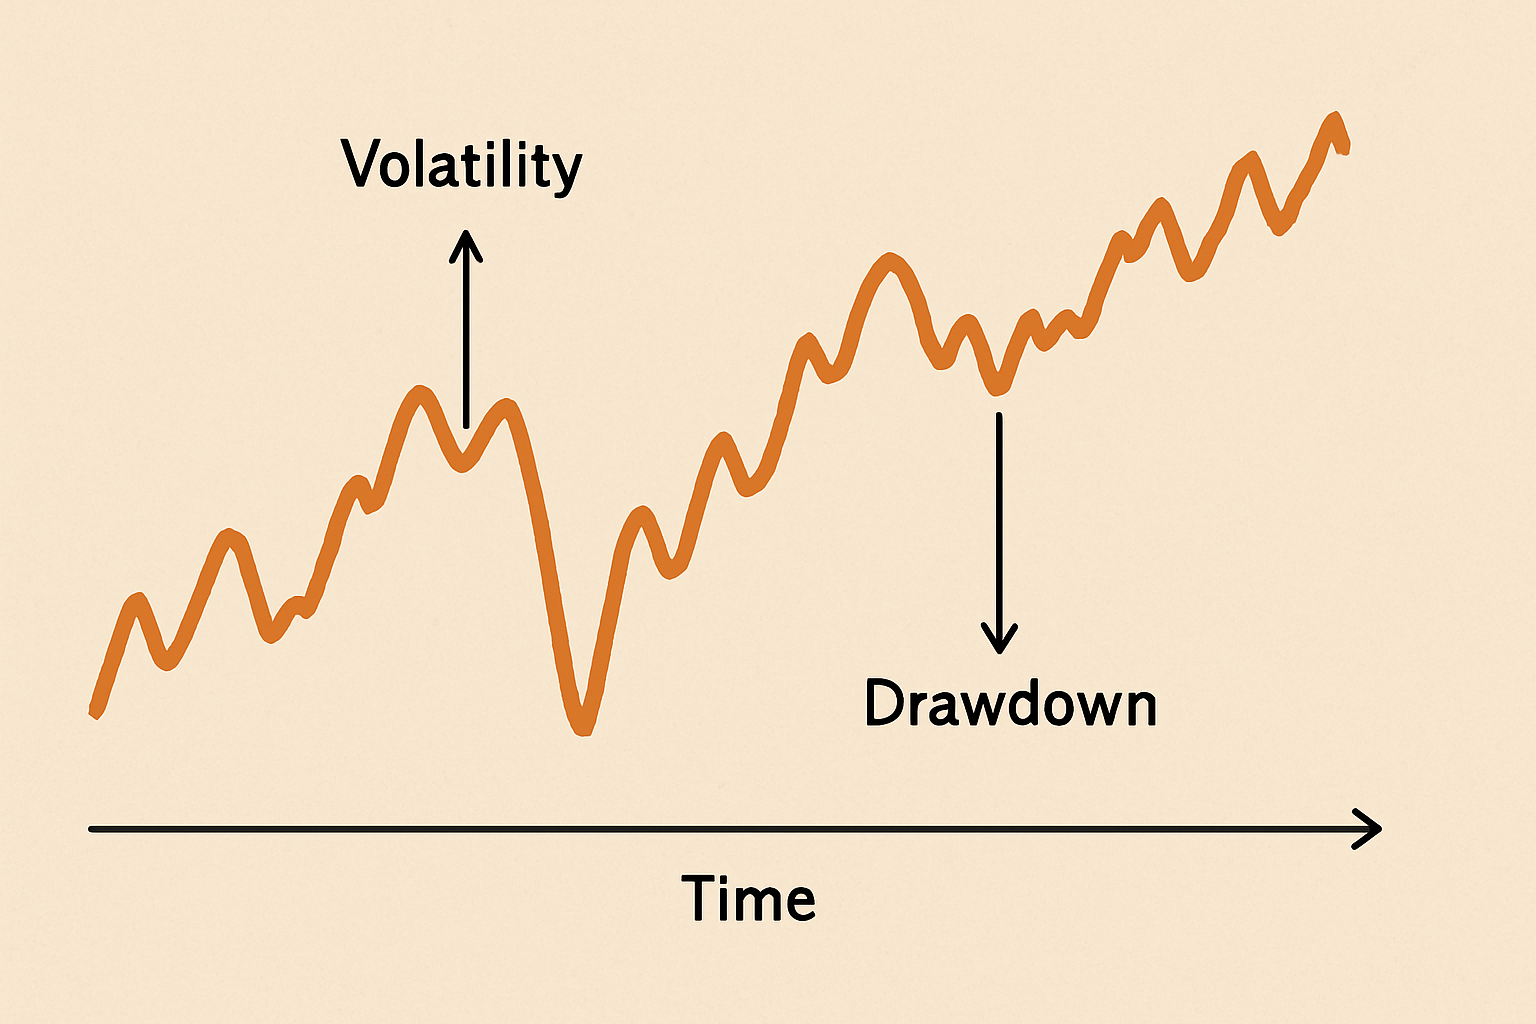
- Volatility is how wildly an investment’s price wiggles around its trend.
- Drawdowns are the drops from a recent peak to a later low; calculate as (peak − trough) / peak.
- Time horizon is how long you plan to stay invested before needing funds.
- The same investment can feel very different depending on the time horizon and the size of past drawdowns.
- Read any chart by asking: How noisy is it? How deep are the pits? How long am I in this story?
You've reached your free daily article limit (1/1).
Create a free account to get unlimited access to all articles, market insights, and more.
Register for FreeAlready have an account? Sign in
Disclaimer: This article is for educational and informational purposes only and does not constitute investment, financial, legal, or tax advice. KAHROS is a financial media and technology company, and the Services, including any AI-generated content and articles, are provided for general information only. We are not a registered broker-dealer or investment advisor. Concepts discussed may not apply to your individual situation. You should consider your objectives and circumstances and consult a qualified professional before making any financial decisions. Please refer to our Terms of Service for more details.
Disclaimer: This article is for educational and informational purposes only and does not constitute investment, financial, legal, or tax advice. KAHROS is a financial media and technology company, and the Services, including any AI-generated content and articles, are provided for general information only. We are not a registered broker-dealer or investment advisor. Concepts discussed may not apply to your individual situation. You should consider your objectives and circumstances and consult a qualified professional before making any financial decisions. Please refer to our Terms of Service for more details.