Risk 101 in One Picture: Volatility, Drawdowns, and Time Working Together
TL;DR
Quick Summary
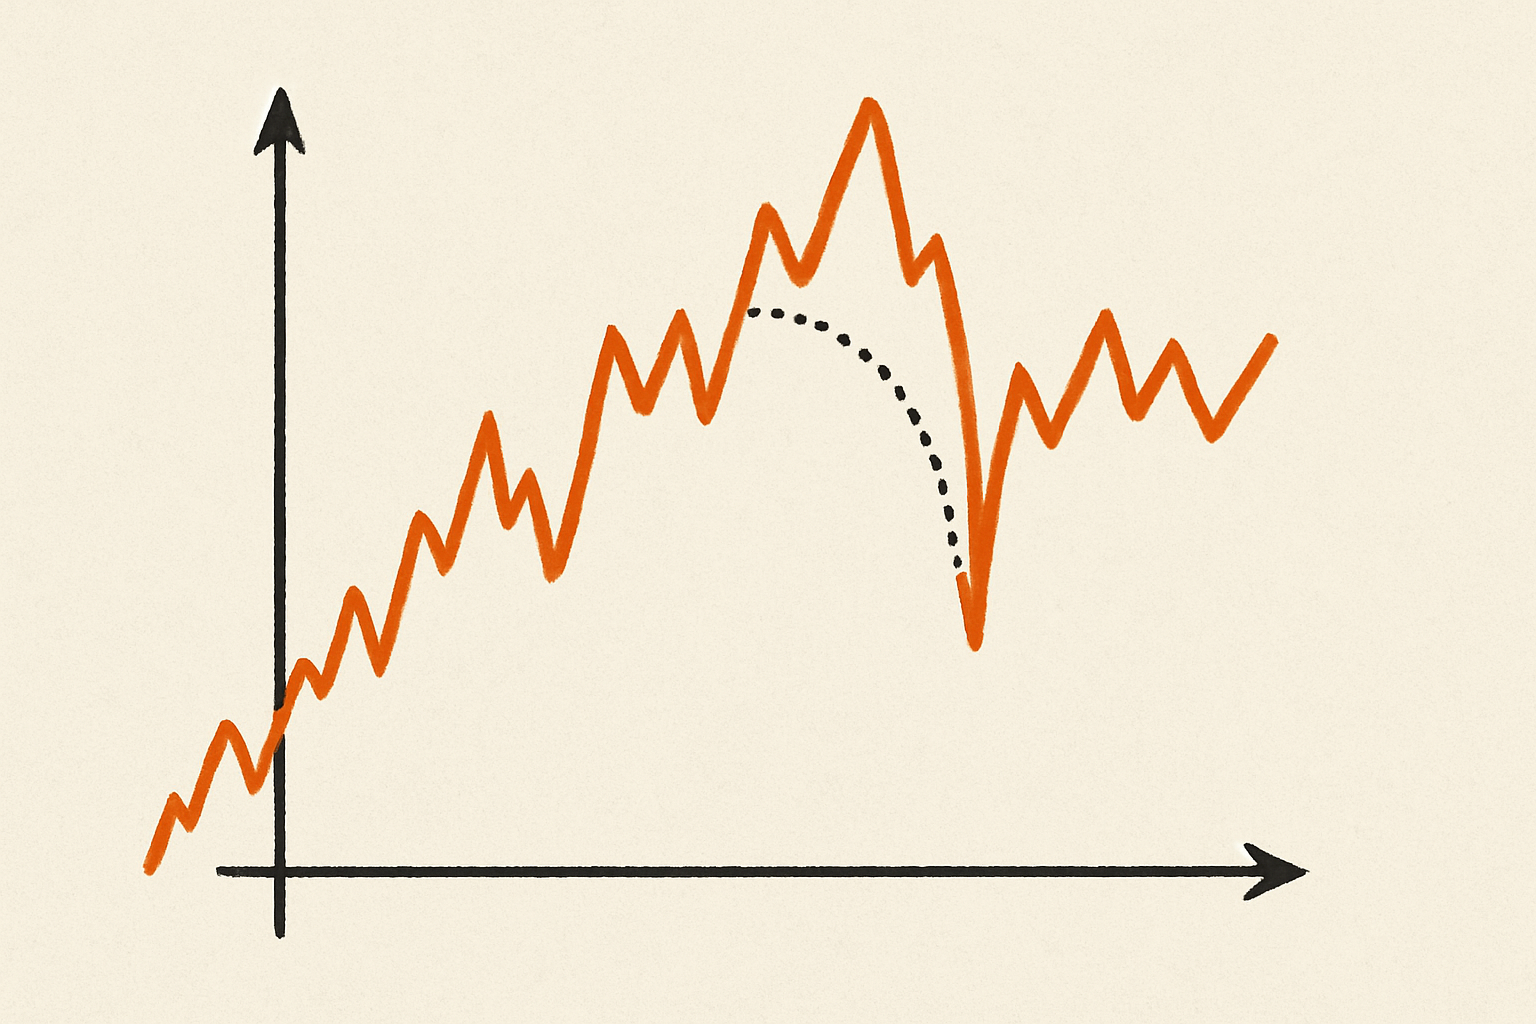
- Risk appears as a wiggly line of portfolio value over time, not a single number.
- Volatility measures how bumpy the ride is; drawdowns measure how deep drops from prior highs go.
- Time horizon changes the picture: short windows emphasize pain, longer windows show potential for recovery (but not promised recovery).
- Different stock/bond mixes create different emotional journeys as well as different return profiles.
- The most useful portfolio is one aligned with your time horizon and ability to tolerate temporary losses, not simply the highest historical return.
You've reached your free daily article limit (1/1).
Create a free account to get unlimited access to all articles, market insights, and more.
Register for FreeAlready have an account? Sign in
Disclaimer: This article is for educational and informational purposes only and does not constitute investment, financial, legal, or tax advice. KAHROS is a financial media and technology company, and the Services, including any AI-generated content and articles, are provided for general information only. We are not a registered broker-dealer or investment advisor. Concepts discussed may not apply to your individual situation. You should consider your objectives and circumstances and consult a qualified professional before making any financial decisions. Please refer to our Terms of Service for more details.
Disclaimer: This article is for educational and informational purposes only and does not constitute investment, financial, legal, or tax advice. KAHROS is a financial media and technology company, and the Services, including any AI-generated content and articles, are provided for general information only. We are not a registered broker-dealer or investment advisor. Concepts discussed may not apply to your individual situation. You should consider your objectives and circumstances and consult a qualified professional before making any financial decisions. Please refer to our Terms of Service for more details.