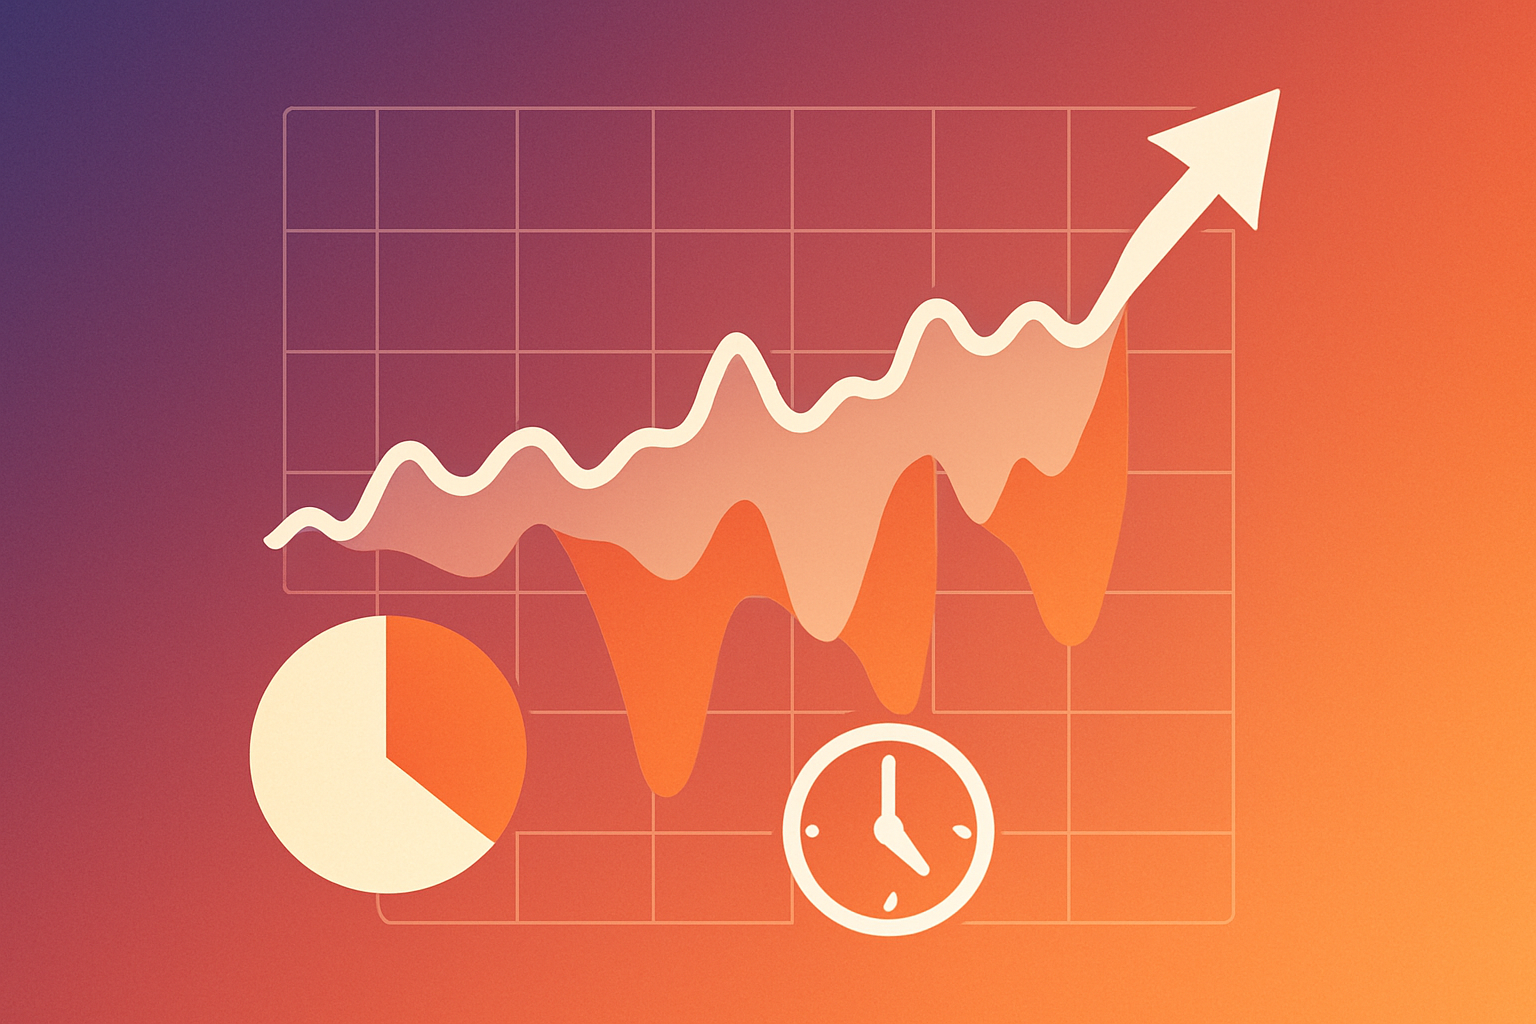
Risk Map: See Volatility, Drawdowns, and Time on One Page
TL;DR
Quick Summary
- Risk makes more sense when you view volatility, drawdowns, and time horizon together.
- The same percent drop feels very different depending on when you need the money.
- Cash, bonds, and stocks occupy different “lanes” that suit different timelines.
- A Day‑0 checklist helps match money to purpose and reduce forced decisions under stress.
- The map is a planning tool, not a market predictor.
You've reached your free daily article limit (1/1).
Create a free account to get unlimited access to all articles, market insights, and more.
Register for FreeAlready have an account? Sign in
Disclaimer: This article is for educational and informational purposes only and does not constitute investment, financial, legal, or tax advice. KAHROS is a financial media and technology company, and the Services, including any AI-generated content and articles, are provided for general information only. We are not a registered broker-dealer or investment advisor. Concepts discussed may not apply to your individual situation. You should consider your objectives and circumstances and consult a qualified professional before making any financial decisions. Please refer to our Terms of Service for more details.
Disclaimer: This article is for educational and informational purposes only and does not constitute investment, financial, legal, or tax advice. KAHROS is a financial media and technology company, and the Services, including any AI-generated content and articles, are provided for general information only. We are not a registered broker-dealer or investment advisor. Concepts discussed may not apply to your individual situation. You should consider your objectives and circumstances and consult a qualified professional before making any financial decisions. Please refer to our Terms of Service for more details.